Railroad behemoth Union Pacific's (NYSE:UNP)�second-quarter 2018 earnings filing was characterized by a healthy bump in volumes, and related advances in revenue and earnings per share. However, the rail freight transportation provider continues to leave some profits on the table, as its efficiency metrics could use some improvement -- a point that management readily acknowledges. Below, I'll assess the company's raw results, examine the details that drove performance during the quarter, and discuss the state of its rail productivity.
Union Pacific results: The raw numbers| Revenue | $5.7 billion | $5.3 billion | 8% |
| Net income | $1.51 billion | $1.17 billion | 29.1% |
| Diluted EPS | $1.98 | $1.45 | 36.5% |
Data source: Union Pacific.
What happened with Union Pacific this quarter?The company's 8% revenue gain over the prior-year quarter was facilitated by a solid 4% increase in carload volume. Management cited volume strength in the company's industrial and premium segments, which offset lower volume in energy and agricultural products.
Firmer pricing and recovery of fuel increases through fuel surcharges, combined with the higher volume, helped overcome a lower-margin mix of traffic.�
Union Pacific's operating ratio rose 1.1 percentage points against the second quarter of 2017, to 63%. The operating ratio is a widely followed benchmark that gauges a railroad's efficiency. It's found by dividing operating expenses by total revenue; lower readings indicate higher efficiency. Thus, Union Pacific's operating efficiency backtracked a bit in the second quarter.
As I've written previously, the railroad is struggling to lift its productivity. Congestion issues in the company's southern region stretching back to last year have prevented it from making the type of efficiency leaps competitor CSX Corporation (NASDAQ:CSX) has recently achieved, wowing investors in the process. Current-quarter operating statistics point to sustained pressure on the railroad's traffic, even as it tries to improve network fluidity. Average train speed decreased by 3% to 24.7 miles per hour in the second quarter, while average terminal dwell (idle) time increased 4% to 29.5 hours.
Union Pacific's operating margin dropped 150 basis points to 37%, despite the organization's ample revenue increase. This is due to the impact of fuel expense, which jumped by $209 million, or 48%, against the prior-year quarter, to $643 million. The higher fuel burden absorbed the quarter's top-line lift, and offset favorable expense variances elsewhere on the income statement. The company reported paying $2.30 per gallon of fuel in the second quarter, an increase of 36% versus Q2 2017.
The railroad repurchased a massive $5.5 billion worth of its own shares during the quarter, bringing total year-to-date share buybacks to $6.7 billion.
The share-repurchase program has been funded with new borrowings -- Union Pacific has issued $6.9 billion in new debt this year. Net of $1.3 billion in repaid debt, the company has added roughly $5.7 billion of leverage to its balance sheet in the first six months of the year.

Image source: Getty Images.
What management had to sayIn Union Pacific's earnings press release, CEO Lance Fritz provided a bit of context around current-quarter issues that have contributed to the marginal increase in operating ratio:
Overall, I am pleased with the effort put forth by the entire Union Pacific team; however, I recognize the results could have been better. ... Network performance improved significantly coming out of the first quarter, but a tunnel outage and train-crew shortages created a headwind in June. I am confident we have the right plans in place to drive improvement in our operations and a better service experience for our customers.
Management is seeking to reduce the railroad's operating ratio to 60% within the next two years, and executives have set a longer-term target of 55%.�In the near term, however, efficiency readings may remain elevated as Union Pacific continues to allocate resources to improve network fluidity.
Looking forwardUnion Pacific doesn't provide detailed guidance, yet management typically offers qualitative commentary on the immediate future each quarter. As for the present outlook, CEO Fritz stated the following in the company's earnings press release: "Looking to the remainder of the year, we expect the strong business environment to continue as we regain our productivity momentum and improve the value proposition for all of our stakeholders."


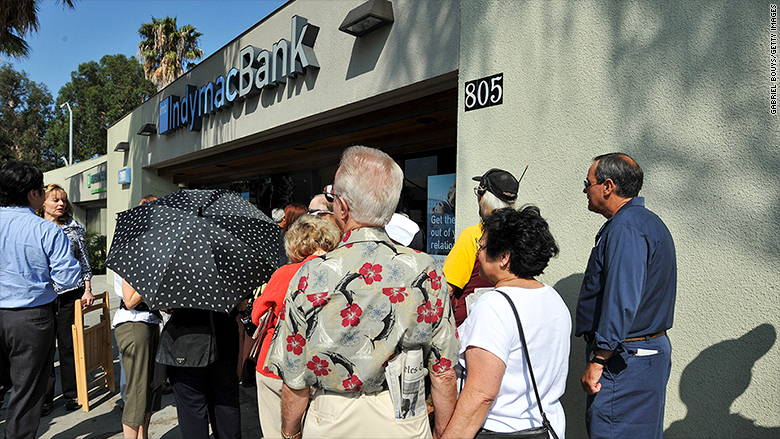 Customers line up to try to get their money after the failure of IndyMac in July 2008.
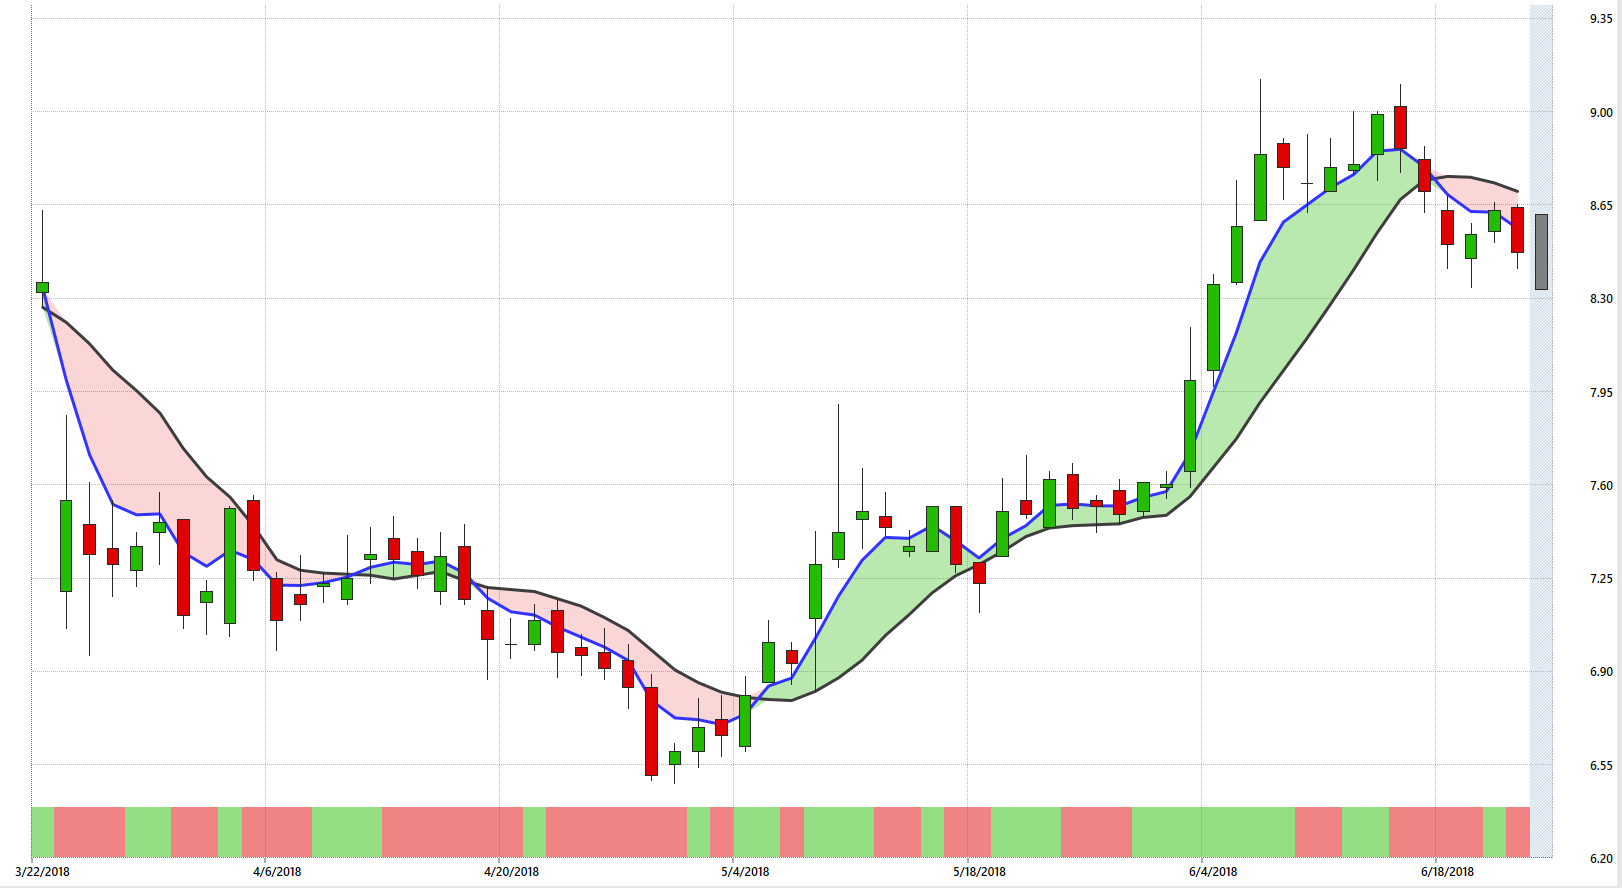
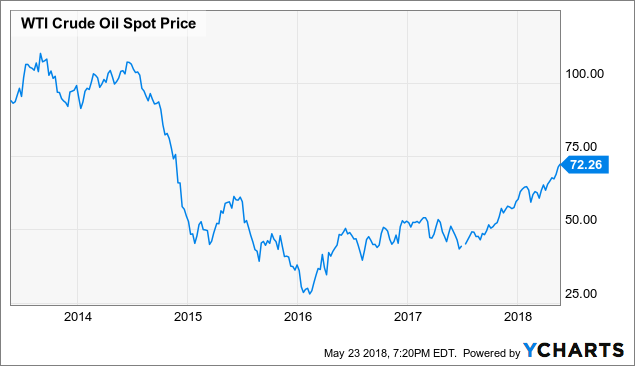 WTI Crude Oil Spot Price data by YCharts
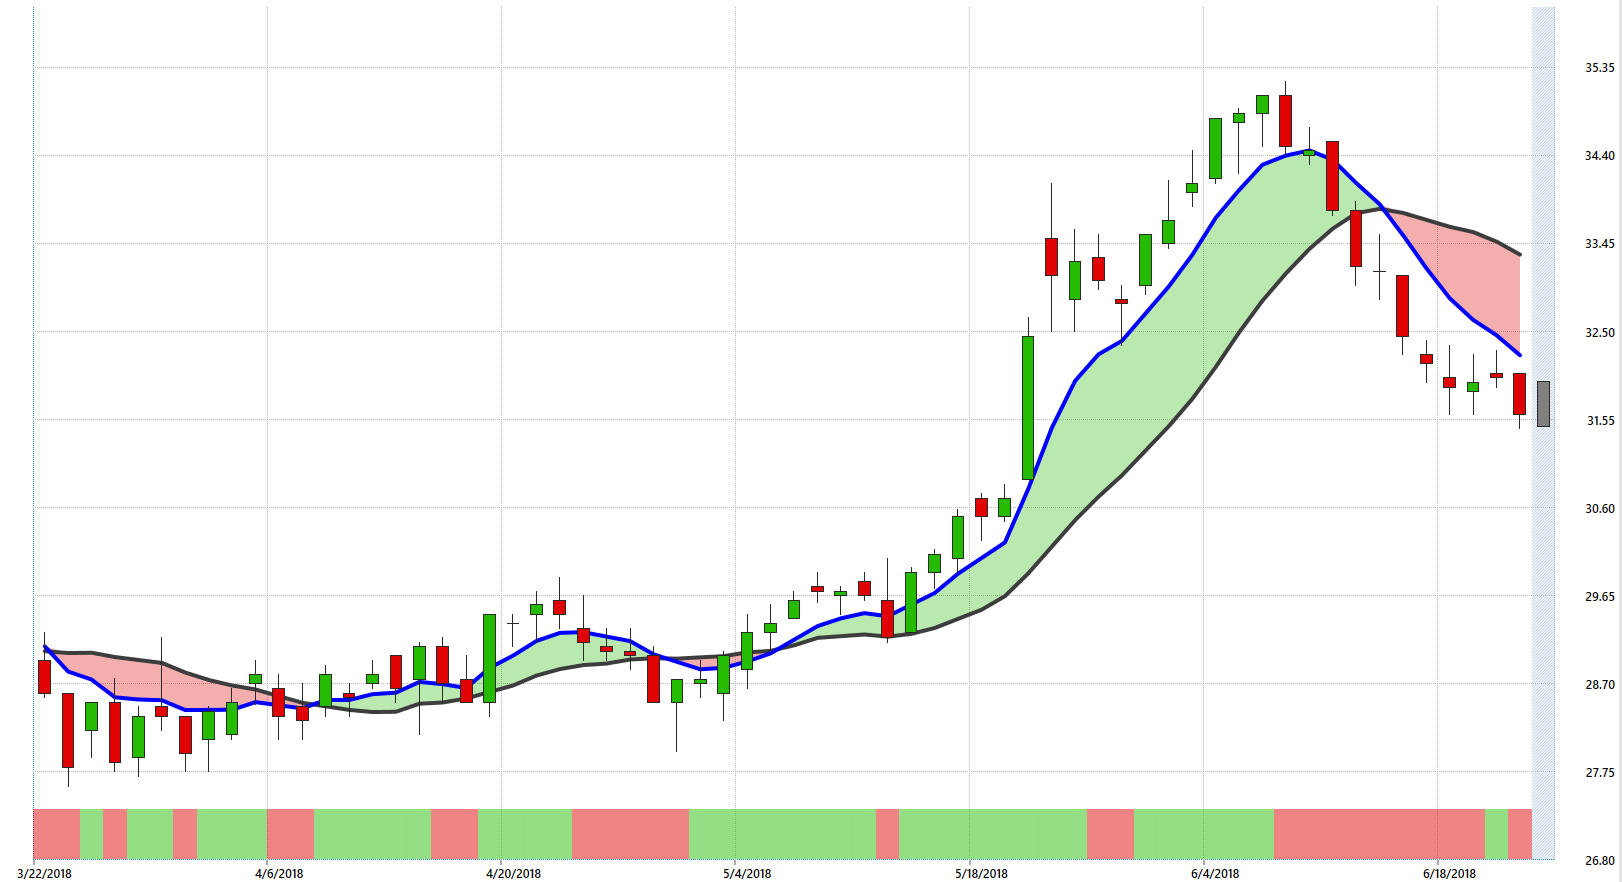
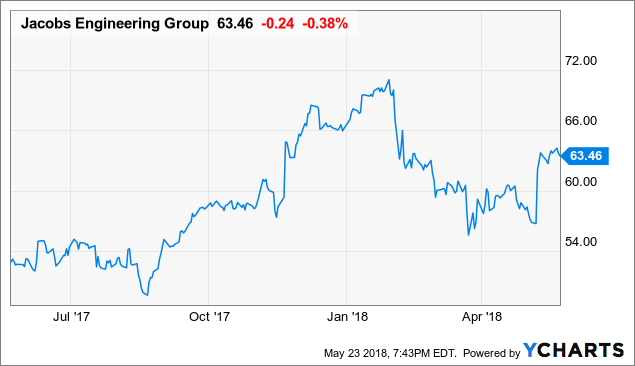 JEC data by YCharts
 24/7 Wall St.
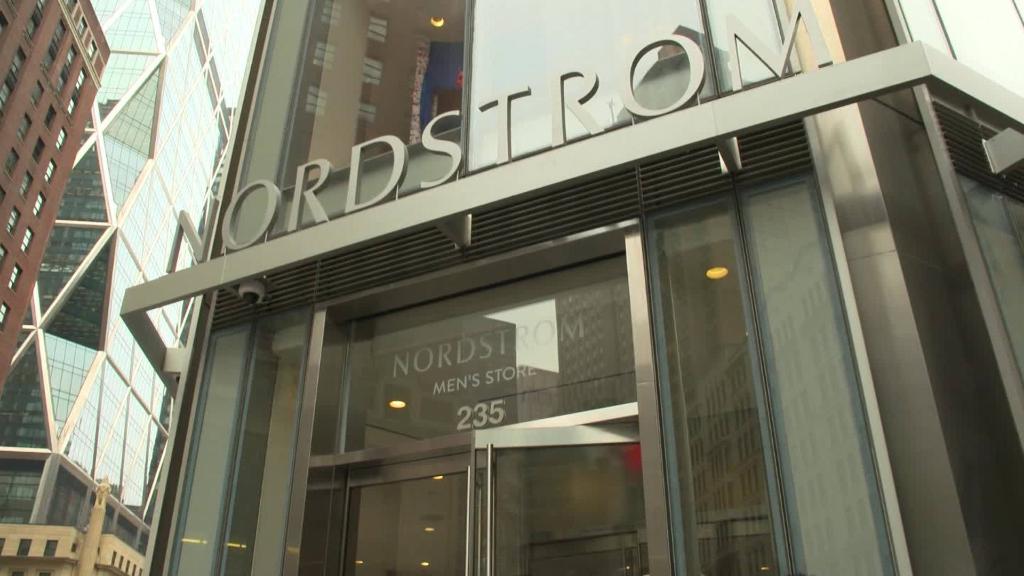 Nordstrom's men's store offers 24-hour curbside pickup