The following five stocks are currently in the midst of uptrends according to VantagePoint, an AI charting platform that uses intermarket analysis to predict future price action 1-3 days in advance.
A couple of things to know in order to understand the charts below:
Each chart is a 3-month chart. Candles represent one day of trading The blue line is a predicted moving average that forecasts a stock's moving average either two or three days out, depending on the chart. The black line is a simple 10-day moving average When the blue line crosses above the black, that's a bullish signal. When the black crosses over the blue, that's bearishFor a more detailed look at VantagePoint's charts, click here.
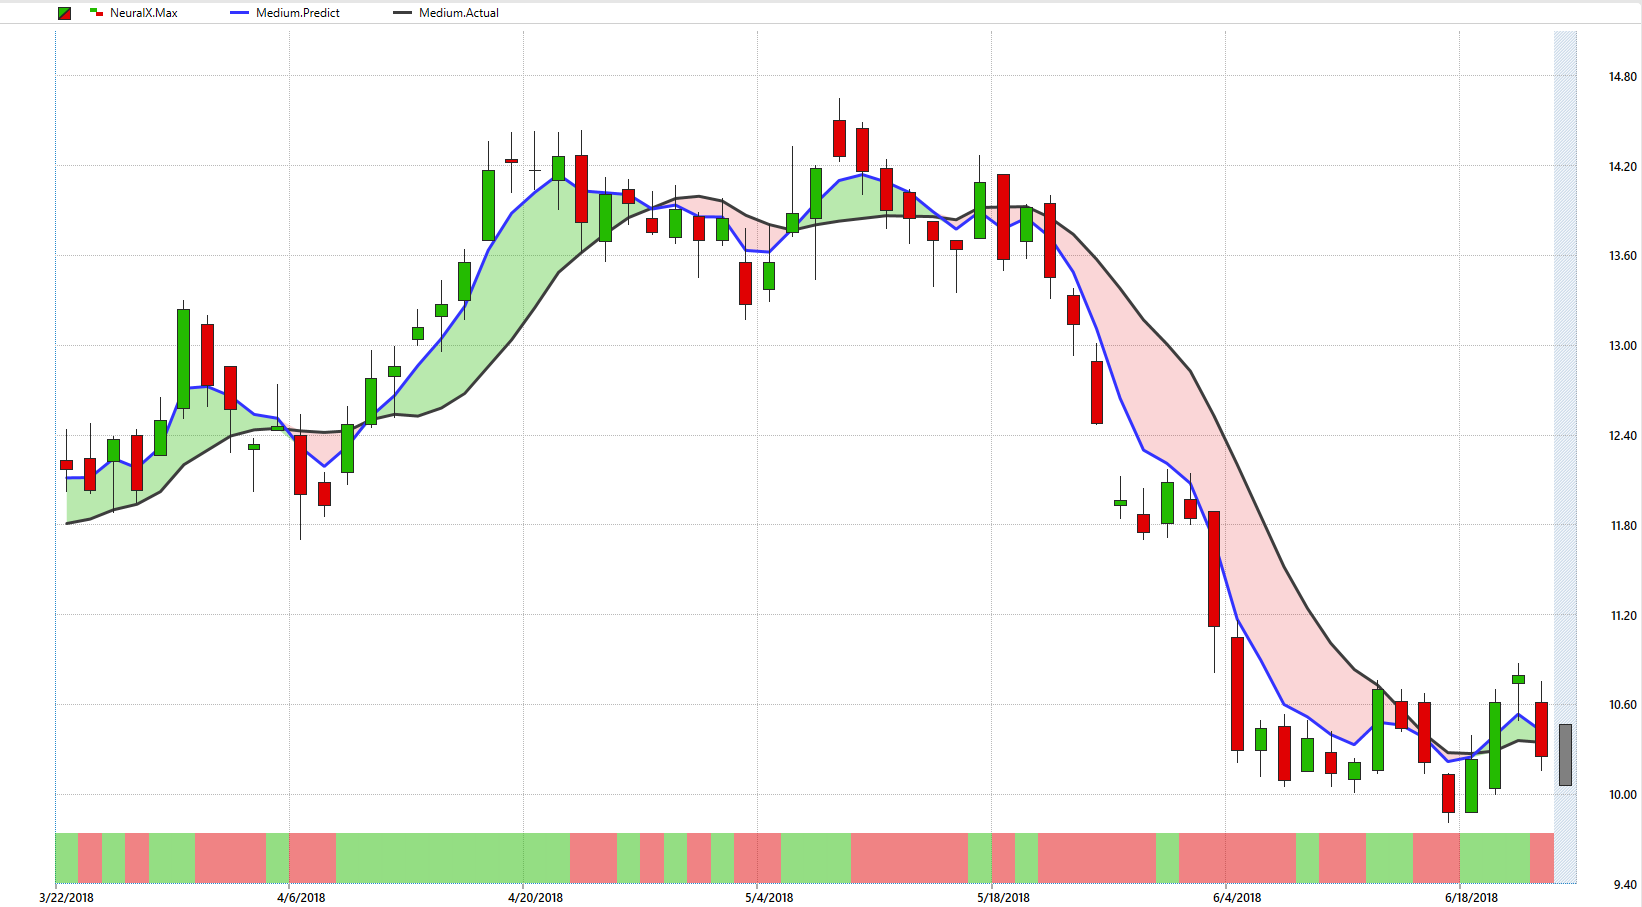
Callon PetroleumCallon Petroleum Company (NYSE: CPE) had a predictive moving average crossover to the downside in mid-May indicating a bearish trend. The stock ended up falling nearly 30 percent over a three week span. But it appears to have stablizied recently. Notice how the blue line, in this case a two-day predicted moving average, recently crossed above the black line. That indicates that the downtrend may be over, or has at least lost a lot of momentum. This could be one to watch for upside on in the coming days.
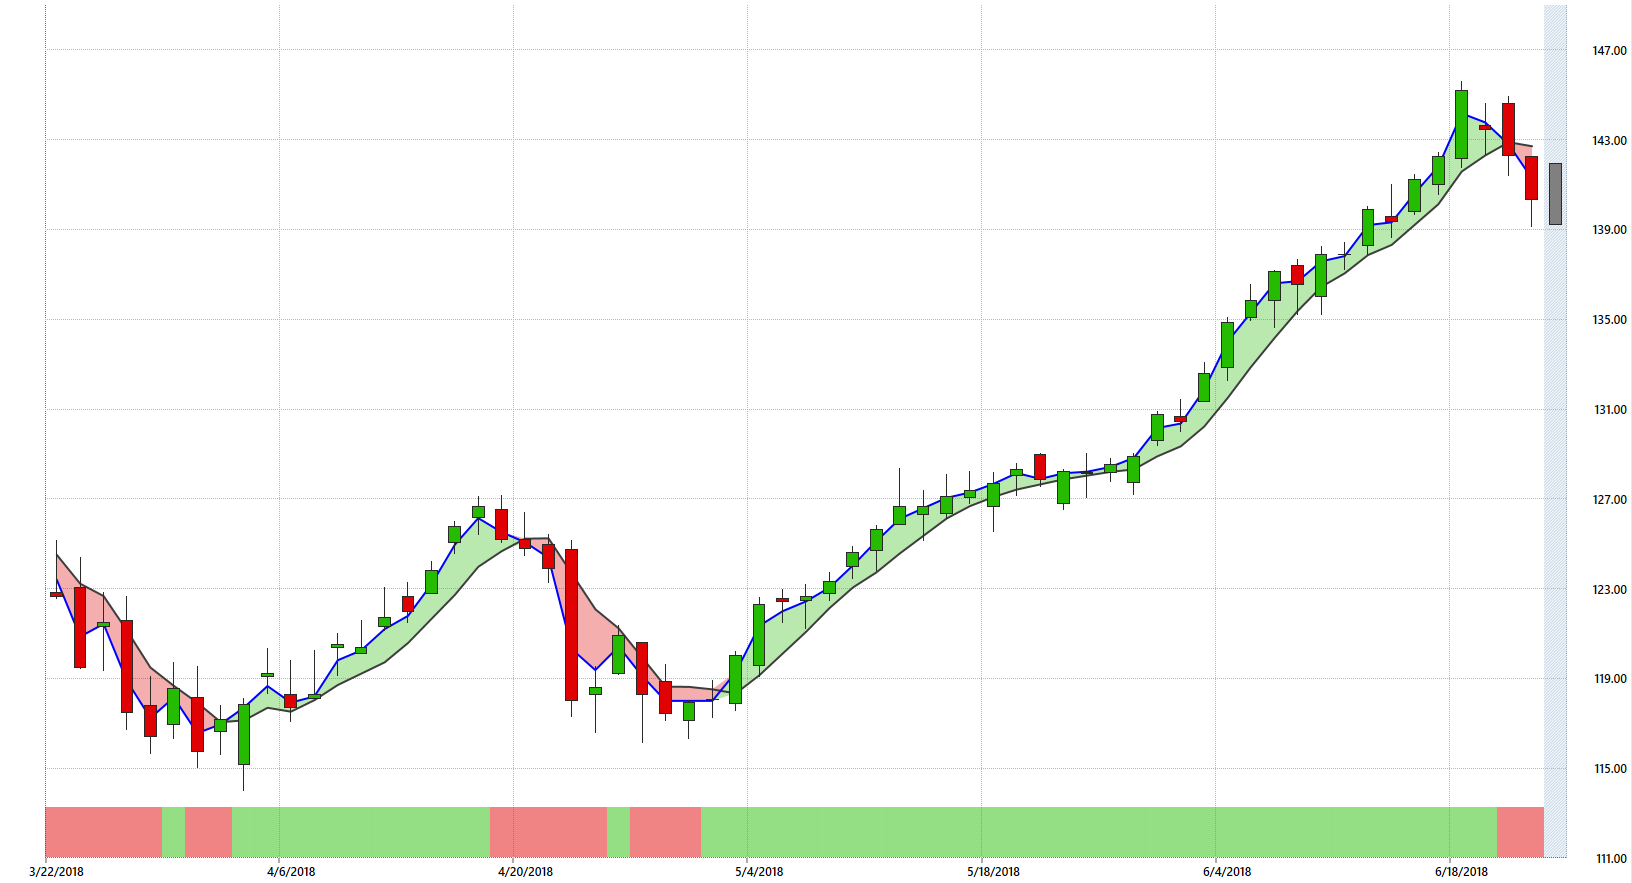
VeriSign, Inc. (NASDAQ: VRSN) follows a similar pattern, but to the upside. The stock had a crossover to the upside in early May, which was followed by a 24 percent rally. But the two-day moving average appears to have crossed over into a downtrend, as evidenced by the weakness over the last three days. The Neural Index at the bottom of the chart also confirms this weakness going forward, at least until Tuesday.
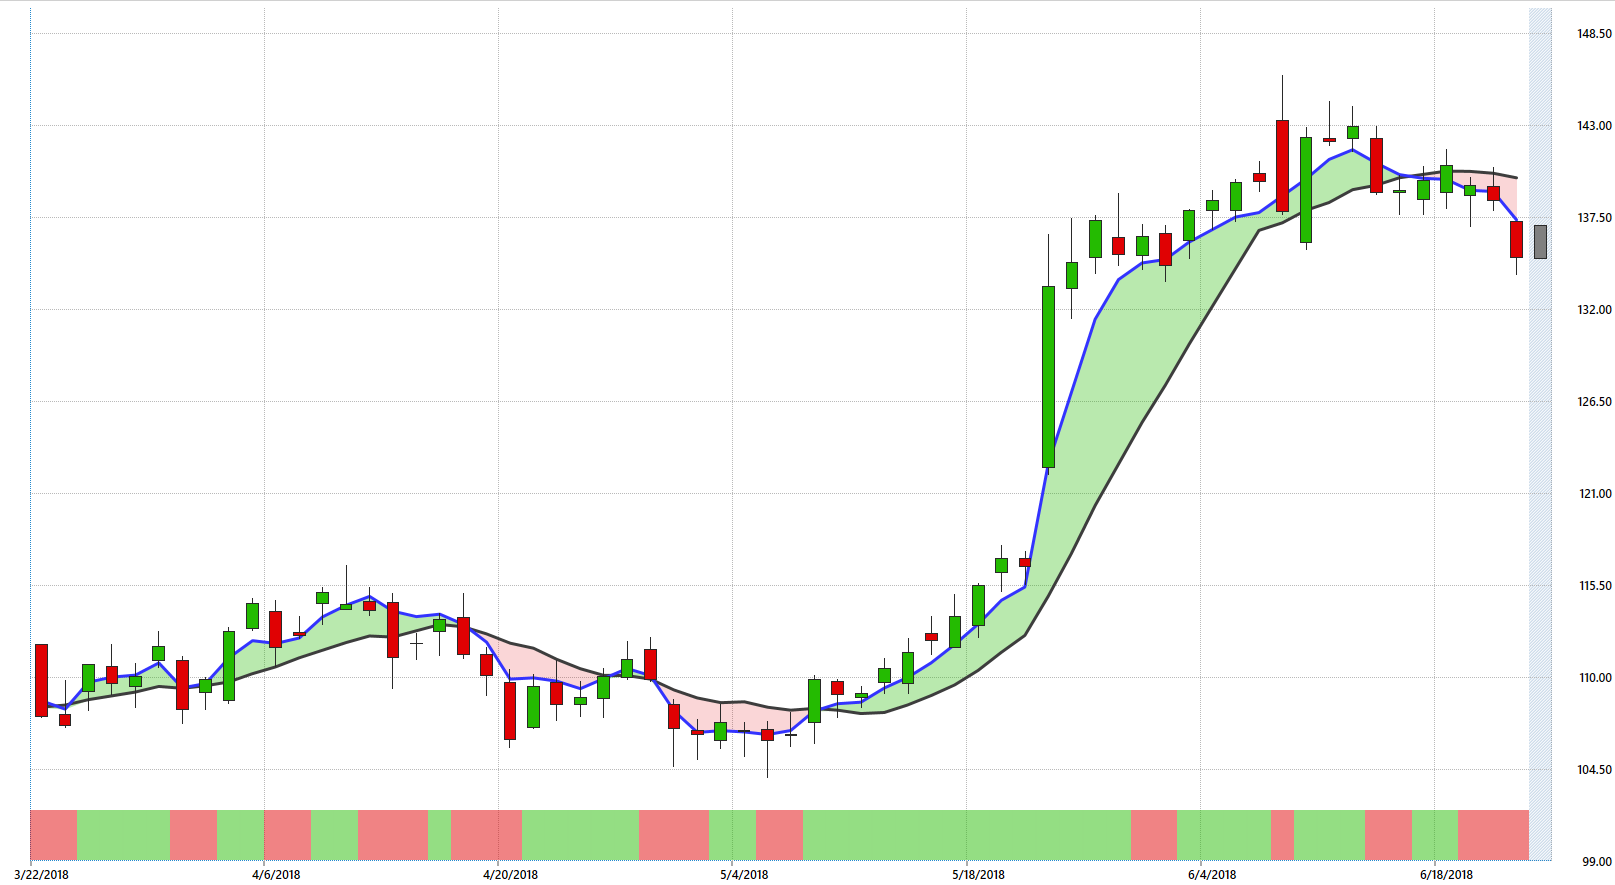
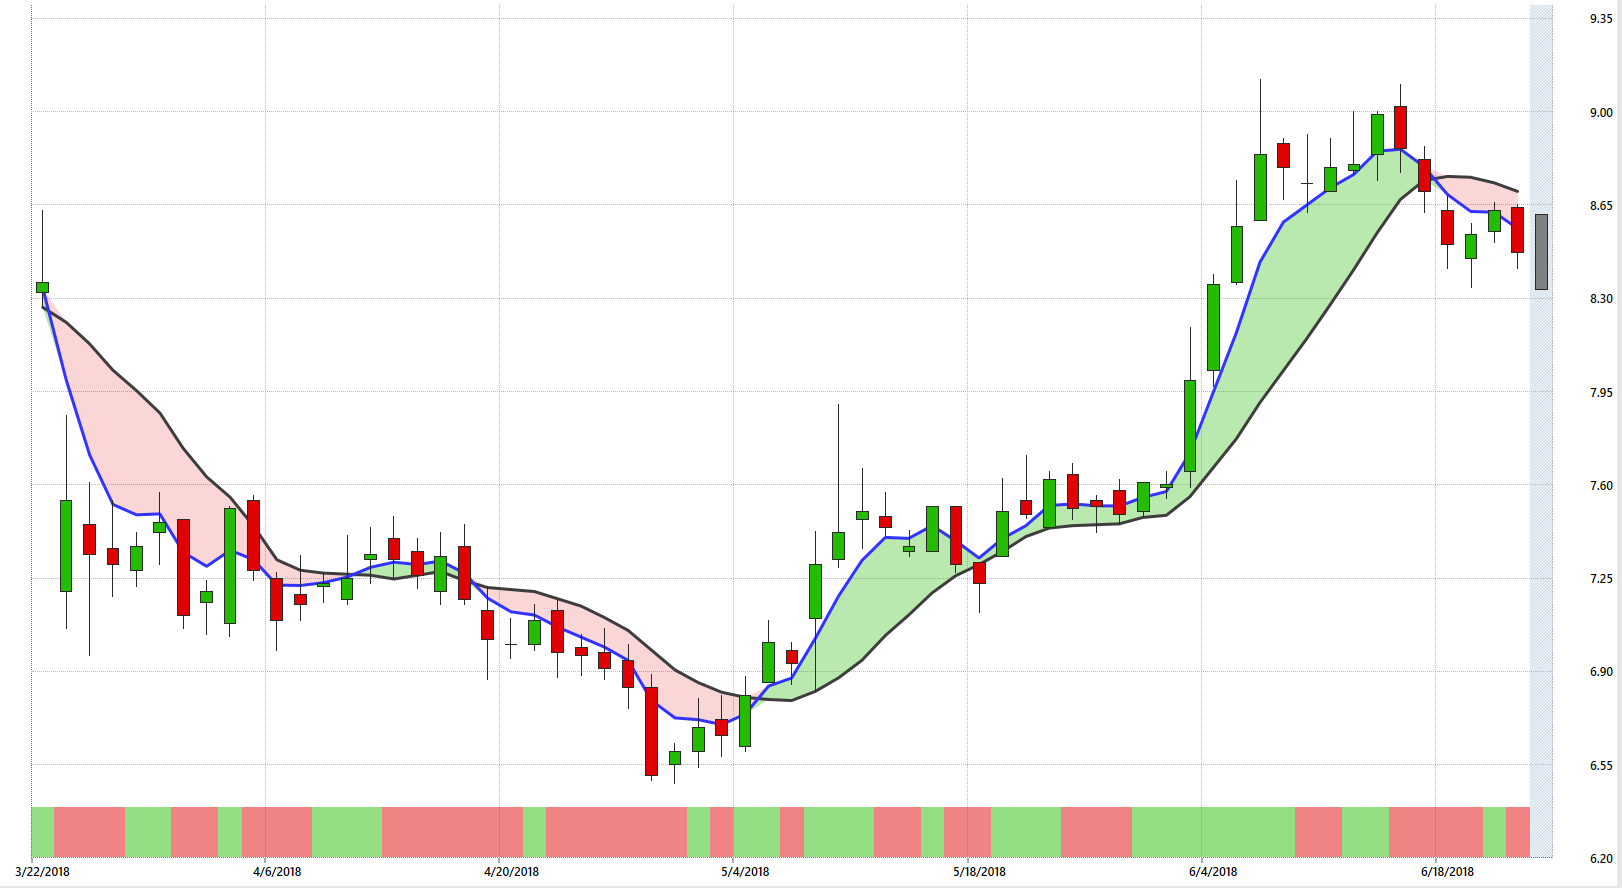
Ralph Lauren Corp (NYSE: RL) also had a bullish crossover in early May, but like VeriSign, the uptrend appears to be over. RL has fallen 6 percent in the last week, and the downtrend looks to be getting stronger as evidenced by the two lines starting to diverge further.
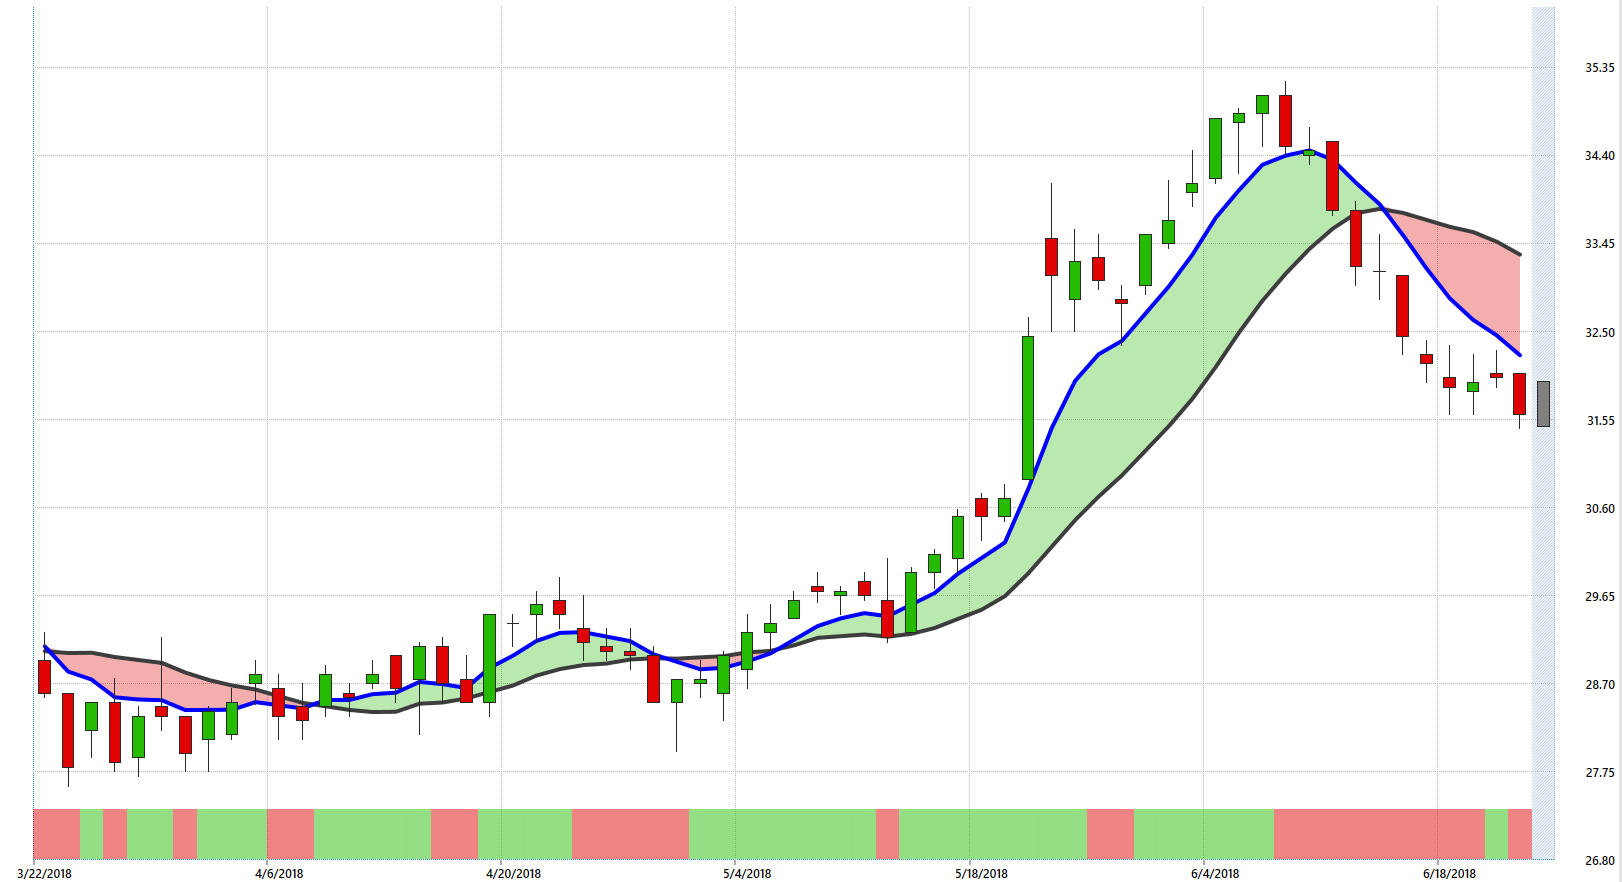
Guaranty Bancorp (NASDAQ: GBNK) appears to be in an all-out downtrend. The blue line on this chart is a three-day predicted moving average. The fact that VantagePoint is forecasting downside as far out as Tuesday, and the two moving averages have only diverged further, tells us this trend is strong. GBNK is down about 11 percent in the last two weeks.
Progenics Pharmaceuticals, Inc. (NASDAQ: PGNX) was in an uptrend, but that appears to have ended. The two-day predicted moving average has crossed below the 10-day moving average, and the Neural Index also forecasts impending weakness. This tell us that the stock's recent 8 percent drop is likely to continue for now.
VantagePoint is a content partner of Benzinga. For a free trial, click here.
No comments:
Post a Comment